Follow the link to find a simulation of the model, on Loures River Watershed.

In this study it was implemented an excess rainfall-direct runoff model, spatially distributed all over a watershed; the model - MODCHEIAS - can overcome pit points and horizontal regions.
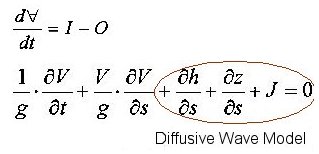
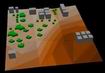
The base equations concern flow dynamics (St Venant and Manning equations) and the geometric conception of the watershed. The watershed is represented by square elements - corresponding to the raster grid of the digital terrain model (DTM) - and each one relates itself with the eight surrounding ones trough outflow relations that use the water surface slope (diffusion wave type). The equations were discretizated using an implicit scheme based on the Preissman's one.
The algorithm used for solving the resulting system of linear equations - Key algorithm - is adequate for large and sparse matrices.
The main input of the model consists of digital terrain model (DTM) values, and of rainfall values (that are considered invariant all over the grid).
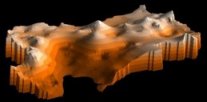
The output consists of distributed water stage values (from wich discharge can be obtained), at each time step and of the hydrograph on the reference element.
The model was implemented on a PC as a stand-alone aplication, using VB 6.0.
To provide the GIS funcionalities, it was used an ActiveX: ESRI Map Objects PRO 2.0 .
The final release of MODCHEIAS was applied on test watersheds, to analyse the sensitivity of its parameters and to comprehend its behaviour. At last, it was tested on the watershed of the Loures river, a tributary of the river Tagus, near Lisbon.
Follow the link to see simulations on test watersheds
MODCHEIAS, with the support of GIS, leads successfully with real topography, with horizontal regions and pit points.
In this way it seems to play in a usefull way, the role of defining, in time, the eventually flooded regions.