 |
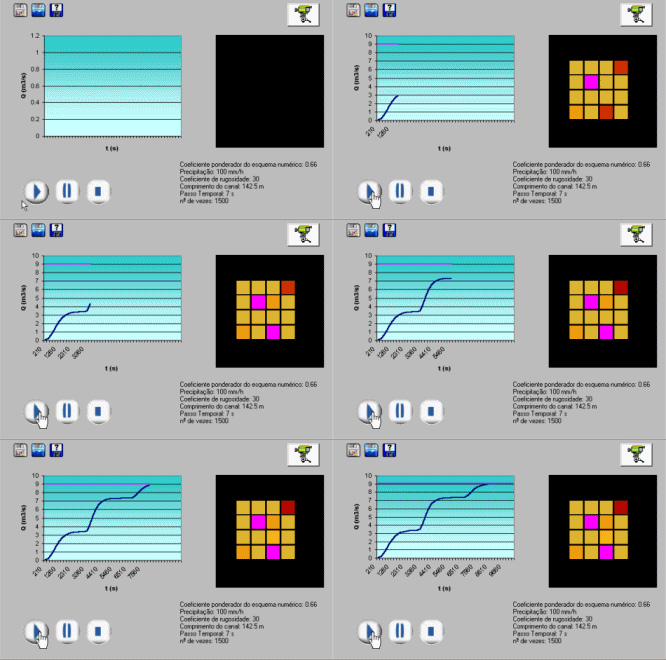
In this watershed it were introduced an horizontal region and pit points, represented in green and orange in the elevation values matrix, shown bellow.
 |
In the simulation, can be seen two platforms, that correspond of the fullfilling of the two pit points. Actually, each pit point is like a barrier and the watershed behaves like it is reached an equilibrium for the sub-basin downwards the pit point.When the pit point is filled, the rest of the watershed suddenly starts to contribute to the reference section and there is a quick increase in the hydrograph. This behaviour will happen with each pit point and this is the reason for the shape of the curve, in this hydrograph.
It is also important to watch the water stages distribution, with the highest values on the pit points, and on the reference section.
 |
This complications on the topography lead to severe limitations on the time step and to slower simulations.
It is expected that a real watershed, presents a more complex combination of the situation presented above, with all the problems, that it can bring to modelling.