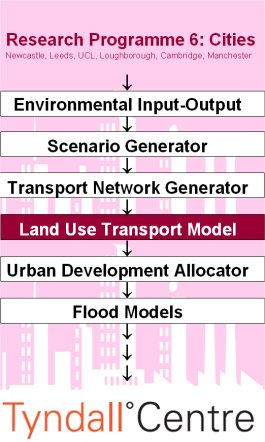
We are building a land use transport model as part of the Tyndall Centre for Climate Change Cities Project. This model sits in a sequence of models that are listed in the attached panel on the right. This begins with an econometric model an environmental input-output model which generates employment totals (as well as many other economic indicators for Greater London and other large regions in western Europe) and these are then input into our land use transport model through a scenario generator. Our own model simulates the location of the residential population as a function of this employment, floorspace and generalised travel cost. The model is currently, in the jargon, a partially constrained spatial interaction/residential location model disaggregated by four modes of transport road, heavy rail, light rail (tube and DLR) and bus, with walk-cycle-other the fifth residual mode.
The model is highly visual as we are motivated to make the entire modelling process as transparent as possible. Moreover to verify the data and to interpret the spatial structure of the metropolitan area, we need as much visual synthesis through maps and graphs as possible.
If you click on the button below, then this will launch a movie which takes you through the sequence of stages from input data to calibrating the model to using it for predictions. When you load the movie, occasionally you may need to resize your window to see the full extent, as the movie was made for 1280 by 800 screen size.

At each stage input, calibration, prediction the user can explore the data in map and graph form and at the prediction stage, the user can alter the data on the fly adding new levels of employment and floorspace and adding or changing the generalised costs of different transport links (for any of the four modes). We have not written any papers on this as yet so the movie of how the model works is the best you are going to get at this stage. There is a general paper on the process of integrated assessment that you can in fact download by clicking here
In fact what we hope to do is to add to this movie, with movies of the scenario generator, the trip and generalised cost computations which precede the land use model, and the detailed disaggregation at the raster level which takes the small area predictions from the land use model and factors these to even smaller areas. This is the point at which the flooding models are then integrated into the assessment of the impacts of climate change.