 |
|||||
|
Limiting Interpretative Error in Analogue-Derived Digital Maps for Environmental Management Ian A Allan and James A Peterson Department of Geography and Environmental Science, Monash University, Wellington Rd Clayton, Victoria, Australia, 3168 email:iallan@geocode.com.au jim.peterson@arts.monash.edu.au home page: http://www.arts.monash.edu.au/ges/ Acknowledgments: The authors gratefully acknowledge the support of Central Highlands Water (Victoria), the Australian Research Council, and the State Data Centre (Ballarat, Victoria). Summary The transition from spatial information systems based on analogue (paper) maps, to those based on digital maps is an inevitable consequence of micro economic reform. Some of the maps (spatial themes) relevant to environmental management can already be assembled from digital spatial databases, but others are still in analogue form. In that decision makers habitually use the paper map, a cultural, as well as a technical transition is implied. It is argued here that data quality retention during analogue to digital conversion cannot be taken for granted. Analogue thematic data for Local Government planning migrates effectively to digital GIS only if underpinning archives are salvaged carefully and data lineage is documented. This must be done well enough for guiding the imposition of constraints on query and analysis procedures relating to inappropriate uses. In that overt application of thematic data needs to be transparent and spatially consistent, online documentation of it should be offered. Options for decision support are explored and demonstrated. Key Words: Geographical Information Systems, Contextual Interpretation, Decision Support, Terrain Information, Local Government Planning, mapping error, environmental databases. Introduction Generalised spatial interpretations and observations are depicted on paper maps with an accuracy that is not always obvious and which is often thought of as being related to the scale of publication. However, claims for validity can only be underpinned by the scale at which the data was collected and by the reliability of observations made in the study that produced the map interpretation (for example, see Angold et al, 1996). In some cases the archive that lies behind the map is detailed and at a larger scale than the "producer defined" aggregation of information that appears in the final published map. In other cases, the would-be user is faced with a map that summarises data collected at a smaller scale than that of publication. The accuracy with which a theme is positioned on a map relates to a number of aspects including the thickness of boundary lines on the one hand and the level of generalisation and/or aggregation on the other. Such data quality issues, long recognised by the Geographic Information Systems (GIS) community (for example, see Burrough 1986, chapter 6) have not always been appreciated by map users, as, for instance Powell (1994) has recently pointed out. In summary, mapping accuracy is directly related to the purpose of the study, the scale of interpretation, the generalisations undertaken in preparation for reproduction, and the scale of that reproduction. While bringing the analogue theme maps to GIS can make the information they contain much more accessible, it adds to the scope for error in constructing and interpreting derived maps. However, the data quality issue does not only involve the nature of the original data and of the way it has been represented. Clearly much of the support for adopting GIS technology arose when it was realised that the mapping details, that hitherto had been archived, could now be attached as attribute files to spatial data bases. However, in the rush to get Geographical Information Systems up and running, and to take advantage of the new digital technologies that allow for quantitative spatial analysis, the retrievable existing data is often digitised (analogue to digital conversion from either stable-base plot sheets or from (non stable) paper) without the needs of spatial query in mind (for example, see Peterson and Wigan, 1995). Ideally, the information with its inherent errors and generalisations needs to undergo great scrutiny before being adopted for digital data handling (Thapa and Bossler, 1992). Almost always it is necessary to convert the raw digital data into a "clean" and edited data set, and sometimes this work includes consulting the original map and field note archives if these are still available. Until the time when Automated Mapping (AM) from regular satellite over-passes is perfected, the interim procedure of analogue to digital conversion, such as that used in this paper, needs to be undertaken. There are many potential sources of error in the process of building and using digital spatial data bases. For example, the vector data model can communicate a false sense of accuracy, while the data aggregation inherent in the raster data model can lead to inaccuracies (Maffini and others, 1989; 56). Error can also be propagated through map overlay operations (Veregin, 1989), incorrect map projections (Monmonier, 1991) and through poorly designed and maintained attribute databases (Firns and Benwell, 1991). More detailed discussion of these (and other) accuracy issues can be found in Goodchild and Gopal (eds, 1989). Monmonier has pointed out that...
This paper is concerned with ways in which the inherent inaccuracies (and "little white lies") within the old producer-defined maps can be minimised so that when the themes they represent are brought to decision support in the form of digital spatial data base outputs, the scope for problems to develop because of the data quality issues mentioned, can also be minimised. The study area used to demonstrate our approach is one for which an adequate-enough archive of analogue maps exists for themes to be referred to during formal disputes over land use zoning change. In recent history, these references did not include cross checking the data archives (such as field note books) or the original ungeneralised interpretation, and it has been shown (for example, Allan and Peterson, 1993) that without that, map accuracy issues render inappropriate some of the uses to which the thematic maps have been put. The challenge now is to prevent such inappropriate use being carried over into the next generation of uses: for example, routine digital spatial data handling in planning permit appraisal. Background to the Study
The study area is located 100 km (around one hour’s drive) to the west of Victoria’s capital Melbourne (see Map 1), and is depicted by that portion of the Warrenheip 1:25,000 series mapsheet (Survey and Mapping Victoria, 1982) that lies within the Lal Lal Water Catchment and the Shire of Moorabool. The Catchment is the source of drinking water for 220,000 people in two regional centres (Victorian Government, 1973), and the portion of it used to exemplify the argument here is characterised by high quality agricultural land long used mostly for potato cropping, but now subject to pressures from rural residential encroachment due to its close commuting proximity to major employment centres. Many smaller land parcels (an historical artefact of former gold mining days: Bate, 1978:121) lie within some tenements. This, in conjunction with the pressure for land sub-division (mentioned above) predisposes the area to much conflict over land use determinations, significant numbers of which have been expensively "resolved" at Administrative Appeal Tribunal hearings (Allan and Peterson, 1993). In the 1980s, Land Systems for all of the State of Victoria were interpreted and mapped (for example, Rowan in Duncan, 1983) using a method based on the FAO approach to land evaluation, (FAO, 1974, 1983)). Other variations to the FAO (1974, 1983) approach can be seen in Weigel (1986) and Wokabi (1988) where land suitability attributes were attached to mapping units.
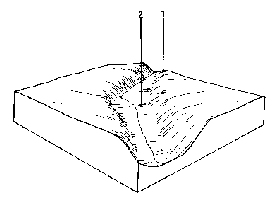
In Victoria, the mapping unit is a Land System which is defined as a terrain type that is distinct from its surroundings in ways that can be expressed in terms of a recurring sequence of Land Components (eg see Goudie 1985). A recurring theme with the land evaluation approach is that "suitability" or "capability" attributes are attached to mapping units, and within the study area, each Land System has between one and six Land Components. Capability attributes vary depending upon the theme to be represented. In Jeffery’s (1980) study, only Land Systems are indicated. Components, many of which are obvious in the field or on a photograph, were not mapped in the final report, but were modelled in block diagrams which refer to attribute tables on a facing page (eg see Figure 1). Because it is the only data set of its type available, the Land Capability maps (Erosion Hazard Associated with Disturbed Soil, Constraints on Construction, Effluent Disposal by Soil Absorption and Rural Subdivision) in Jeffery (1980) which were derived by attaching attributes to the Land Systems mapping (Jeffery, 1980) have been used for land use decision making, even though they are in many ways inappropriate because they are of small scale (1:50,000) and lack a coordinate system such as would allow other map themes (for example land ownership) to be registered to them. Further reservations may be expressed in the light of the following comment...
However, it is clear from Administrative Appeals Tribunal reports that, in the absence of better information, the major parties in conflict over land use determinations are using this small scale analogue version of the terrain data to tackle their large scale (land parcel level) problems. The following two quotes illustrate this point...
Use of the Land Capability study (Jeffery, 1980) is now entrenched into the decision making process through both litigation and negotiation processes, and is accepted by all parties to what amounts to an ongoing conflict between a local government authority intent on fostering closer settlement in unsewered areas, and a water supply authority intent on maintaining water quality. It has been argued previously (Allan and Peterson, 1993) that the outcomes of such a parcel-by-parcel approach to conflict resolution are not inherently consistent in spatial terms, but that the implementation of spatial modelling at each hearing or negotiation would allow cross checking with previous decisions, and with the spatial implications of the set of rules that derive from the planing scheme. The relevant information flow paths might, therefore, be better incorporated into map models that include the terrain suitability data. However it can be shown that a digital version of the 1:50,000 scale Land Capability map (published without coordinates) is not good enough for implementing the terrain data for parcel level appraisal, and hence this present attempt to recover the information lost in the process of producing the original Land Capability Study report.
Salvaging Data And Information From The Analogue Archive: Technique It was fortunate that the air photographs, upon which Jeffrey marked his Land Systems interpretation boundaries were retrievable from archives. They were enlarged (1:10,000) versions of the original, but irretrievable 1:63,360 (nominal scale) negatives (project date 1976; Jeffery, 1980: ix). As such they had no fiducial, height or lens information such as would have enabled photogrammetric correction, which, in the absence of the original negatives (or the control position) were judged to be suffering excessive distortion and to be of dubious quality for the kind of planimetric mapping needed to build a digital spatial data base. Using these archival photographs, and Jeffery’s report descriptions as a guide, the Land System boundaries were stereoscopically re-interpreted and traced onto modern 1:15,000 scale aerial photography (QASCO, 1993). In addition to the colour scanned (and later photogrametrically corrected) photographs, the following six themes were interpreted: Published Land System Boundaries, Re-interpreted Land System Boundaries, Unpublished Land System Boundaries, Dams, Drainage Lines and Escarpments. Instead of mounting the photos in a photogrammetric plotter (and expensive procedure that is unlikely to be widely adopted), the boundaries were transferred onto stable base mylar and scanned, vectorised and imported into PhotoGIS, an Arc Info third party product used to correct photogrammetric distortions. This product refers to a TIN Digital Elevation Model which was created using the Survey and Mapping Victoria 1:25,000 series 10 metre interval contour data. There were fourteen photographs in all, and so around eighty digital files were generated, each representing a single theme for a single photograph. Photo by photo, they were joined to be included with the planimetrically compatible data set (six themes). The reinterpretation of the Land Systems map called for cross checking of the published version with the original version on Jeffery’s archive photos (with the Chinagraph markings), and with terrain as depicted on the 1993 photography (viewed under a stereoscope). The all-important step of eliminating the effect of height distortion on the position of Land System boundaries, and of registering colour scanned photographs and the photo derived themes to the Survey And Mapping Victoria 1:25,000 scale mapping base (using PhotoGis) could then take place. Using the annotated archival photographs as a guide, it was possible to gain a more precise interpretation than would otherwise have been the case. Land System boundaries could be mapped at a comparable scale to that necessary for mapping land ownership. Although one must be mindful that the original interpretation by Jeffery was undertaken in the knowledge that the study would be generalised and reproduced at a smaller scale than did justice to the data, it was found that in this case, the data lost in the map generalisation involved the accuracy of boundary positioning rather than the existence of boundaries.
Some Conceptual Constraints The advent of digital spatial data handling has brought with it the ability to attach attributes to objects within a map such as a street name to a road vector, ownership to a land title polygon, or soil type to a soil polygon. Information referring to the first two items may become out-dated without proper reporting procedures during data maintenance. On the other hand, landscape features (such as soils) are more difficult to document accurately because they are highly variable in pattern. The problem is that a soil polygon represents an aggregation of thematic factors (eg colour, texture of A horizon, depth of regolith, permeability rating, and so on), the precise distribution patterns of which are lost at the time of data aggregation for soil map compilation. As Tian and Peterson (1992) demonstrated, landscape attributes can be aggregated in many different ways, only one of which is used for publishing the thematic (producer-defined) map. Retrieving the distribution of factors is impossible unless the full data archive is available, so multiply-tagged polygons, in analogue form are unsuitable as sources of primary themes for building a spatial database in a GIS, although often this type of secondary information has (we argue, ill advisedly) been used as a primary input into a GIS. Thus there is a problem for those intent on implementing GIS for decision support if the derived maps (with their loss of original thematic data) are accepted by decision makers. As Thapa and Bossler (1992) point out, passive acceptance of data quality from aggregated sources offers no means of communicating the likely accuracy of output. In the same vein, Burrough has pointed out that...
Clearly, when compiling a digital spatial data base from derived secondary data sources (existing paper maps of aggregated themes) much "reverse engineering" (for example, Allan, 1994) of one kind or another is called for unless repeat thematic terrain surveys can be funded. However, field notes and other archives (both digital and analogue) can suffer from degradation in the hands of disinterested or unqualified keepers. To counter this, Tian and Peterson (1992) have proposed that all data collected should be mapped and stored digitally and independently to the final map production. In the long term this would ensure that users would have access to the information from which a map was derived. Adoption of such a database management practice could be made in a way that was linked to routine database updating procedures. This implies savings to the public purse through the avoidance of study repetition, data loss, and from exploiting the ability to add value to data sets by relating them to other data themes within the digital mapping base, and presumably to a higher standard of decision making based on the improved data sets. Gradually, much (perhaps nearly all) of the information in archived analogue data, including that which refers to data that has been generalised "too much" in the final summary map, can be restored. It is worth noting, however, that this is not routinely possible unless data archives such as field note books are available, or there is a data model to refer back to, such as there is in the case of the Land Systems mapping projects that include the kind of information represented in Figure 1.
Application: An Example In many Local Government Areas, the multiple and competing uses for land resources accompanied with a greater public awareness of issues relating to environmental degradation, means that decision makers are more likely to be held accountable for a land use decision they might make (Pereina and Itami, 1991). In that first steps in the logical order of adoption of digital technologies in local government (automation of rating and in-house records, and recording of assets takes precedence over obvious but later developments (for example, routine manipulation of terrain information), it is two dimensional vector analysis (though more recently, bitmap display functionality as well) that has been favoured when planning information technology budgets to meet local government tasks. Thus, not only the available functionality, but also the appropriate expertise, remains dormant or inaccessible. The challenge of capturing and applying in a GIS environment, the terrain information (and in this instance the expertise recorded in the archival Land Systems study), relevant to decision making is therefore still largely unmet, even though it is routinely referred to in analogue form. A common problem with such reports (which Jeffery (1980) partly overcame through the use of block diagrams (see figure 1)), is that although attribute tables are included, their value is not easily communicated to the lay person, and thus their potential utility can be ignored, or if appreciated, it will be by the development permit appraisal authority, and not by the permit applicant. Here we suggest two ways to overcome this problem. Both involve replacement of Jeffrey’s stylised block diagrams with digital equivalents. The first technique involves the scanning and annotation of colour photography of each Land System, with annotations placed on each component, and the second technique involves the use of photogrametrically corrected "screen captured" and annotated aerial photography draped over a Digital Elevation Model (DEM), each one drawn from a typical example of each Land System. It is even possible that, if the growth in computing power and functionality available for routine uses, continues, and the user base becomes more highly trained, any land parcel and its environment could be modelled in this way on demand.
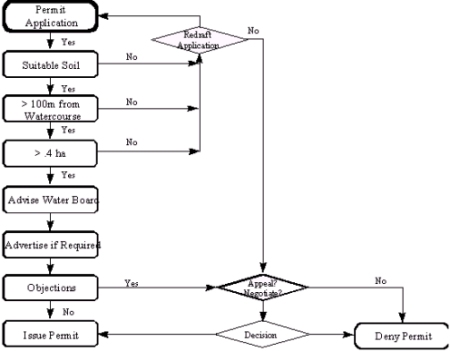
Spatial data has always been a part of land use zone decision making but the adoption of digital spatial data handling techniques offers "real time" access to it, and attached attribute data, once the analogue to digital data conversion has taken place. The conversion need not wait for digitally-recorded repeat surveys of terrain themes (using, for example GPS and Remote Sensing techniques) even if, as for this study, the Land Component information from the Land Systems survey is needed, but not directly retrievable. Instead, digital assembly of terrain themes by reinterpretation of the Land Systems using existing analogue data as a guide, allows an adequate data set to be assembled so that the terrain data, previously used in analogue form in development permit appraisal can be made available to all interested parties. For instance, referring to the information/decision pathway that local government planning authorities must follow for unsewered development in rural land sub-division (see Figure 2), development permit appraisals could be compared to a digitally modelled constraints map that took into account a parcel’s size, soil, and distance from watercourse, thus making permit appraisal a friendlier and more spatially consistent procedure. However, such digital spatial data handling brings with it the potential for erroneous appraisal by using the data at a larger scale than the scale of collection will support.
Introducing the "Smart Map" concept To meet the need for including thematic data in permit appraisal, while at the same time, mitigating the danger of unsuitable application at land parcel level, it should be possible to arrange access to relevant parts of the data base through computer network interface functions readily available in most desk top vector GIS so that a version of the photogrametrically corrected air photo or (rectified) satellite image appears under whichever land parcel layer is displayed. In many Spatial Decision Support Systems it is common for a multitude of two dimensional cadastral mapping themes (eg land use zoning, land ownership) and their attached attributes for a given area to be available. Terrain-based information such as soil or Land System boundaries could also be attached in digital form such that, by inference, it is known that tabular information referring to the overall distribution of the terrain type under appraisal is available. The lineage of all the spatial data files and related files in the attribute data base should be known (for example, see McDougall, 1975), and the scale at which spatial query is appropriate should be set at that. Outside such bounds, on-site inspection would be indicated if decisions cannot be made from digital spatial query.
The Lal Lal Catchment "Smart Map" Our "model" Spatial Decision Support System has four components, and these can be described as georeferenced "backdrop" information, non georeferenced raster "site" information, "descriptive" information, and soft coded "contextual" information. On entering the system, a rectified and enhanced Landsat TM true-colour composite image is displayed as a backdrop. On zooming to depict individual land parcels, the satellite imagery is replaced by a low resolution (at 200 Dots Per Inch each pixel represents 190.5 cm at an average scale of 1:15,000) scanned and photogrametrically corrected version of the (ungeneralised and unmodified) aerial photographic base data from which the mapping themes were derived. The Land System polygon boundaries that were derived from interpretation of the base photos are overlayed onto these. Modern desktop mapping systems (the type that would most likely to be used at front desk level in a Local Government) have the capability to allow mapping themes to be displayed only at pre-determined scales, and so the maximum zoom level for each theme is set at the scale at which it was produced to be used; in this case, Survey and Mapping Victoria data at 1:25,000, Air Photo derived data at 1:15,000, and land titles information at 1:10,000. Operations not supported by the accuracy of the database (such as querying the area of a very small land parcel in relation to an intersecting planning zone buffer derived from the Survey and Mapping data set) are disabled, and so in contentious cases must be subject to field inspection. Clearly, in a planning sense, the results of any spatial query, when displayed in conjunction with the primary database (as represented by the aerial photographs as backdrops) are likely to have greater acceptability as a focus for debate during land use conflict resolution, than will diverse mental maps and paper maps. As early as 1969, Chorley saw the potential of Geographical Information Systems when he stated that digital map analysis and processing is…
In the same vein, GIS also has the potential to release masses of data locked in thematic maps and the reports that accompany them. This idea makes the block diagrams in Jeffery’s (1980) study worthy of closer attention.
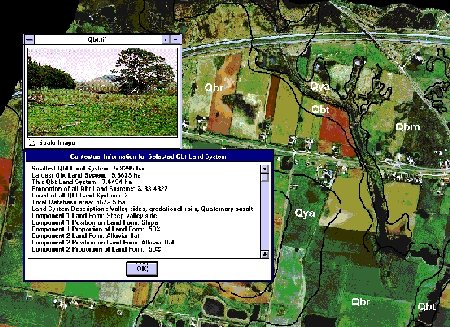
In our Smartmap (see Figure 3) when a Land System polygon is selected, two "pop-up" windows appear. The first window displays a representation of Jeffery’s block diagram. In this case, it is from a (scanned) digital version of a colour photograph taken in the field (options for including digital images in GIS were explored recently by Jamilla and August, 1996). Characteristic component features in the landscape are tagged with an appropriate identifier so that, now, each component can be viewed in 3d pictorial form. The second window contains text describing the pictured Land System and its components. Using this technique, a permit appraiser/decision maker can more easily identify System Components (and their attached attributes), and assess their relative significance in regard to a particular land parcel or stream buffer. This information would also assist permit appraisal personnel to communicate the fuzzy nature of the Land System and component boundaries, and explain appraisal criteria to applicants in a way that is less likely to arouse hostility to "black box" science than would reference to generalised block diagrams and accompanying sheets of model attribute tables. In addition to descriptive information, the second window also contains contextual information (as explained by Gahegan 1994, 1995). In the absence of the functionality of a GIS, it is difficult to assess whether a mapping unit might require consideration beyond normal development requirements because it is, for some reason, unique. In an effort to better inform day-to-day decision making, the Smartmap (illustrated in Figure 3) provides the following information for each Land System, all of which is soft coded (except the area of the queried Land System polygon, which is calculated at the time of its creation).
Contextual information such as this would allow all parties to a development proposal to discuss concerns while referring to a common spatial database and a meaningful description of the area in question. In the example (see Figure 3), concerns might be raised over a development proposal if the Qbt Land System was known to be valuable wildlife habitat. The contextual information shows that there are only three Qbt Land Systems in the database, that all are relatively small, and the Qbt polygon being queried represents around a third of all Qbt Land Systems and constitutes a very small portion of the total database area. Central to the flexibility of this system is that the contextual information is calculated at the time of query execution. This means that the spatial database can be expanded without affecting the reliability of query results - in fact, the act of expanding the spatial data base acts to add greater meaning to the contextual information. It is envisaged that the implemented "Smartmap" would use Hypertext functionality to display the full array of Land System, Land System Component, and Land Capability information contained in Jeffery’s (1980) study.
Conclusion The archival data behind thematic maps relevant to planning scheme permit appraisal are an important support in bringing the themes to digital spatial data bases during the analogue to digital data handling conversion that is taking place in societies adopting GIS for land use administration. The approach outlined here reduces the scope for error in GIS application of thematic data by "flagging" queries made at a level of detail greater than data acquisition will support. Before any theme is included in a GIS, an analyst must ask whether the scale at which the information was captured is appropriate for the level of detail required. If not, then re-mapping at the appropriate scale needs to be undertaken, or else other data sets such as the annotated field photography, descriptions, and contextual information demonstrated as a part of the Smartmap concept included so as to allow cross-checking of scope for error introduced by the inclusion of otherwise potentially inappropriate data sets. Such applications as suggested here would also indicate which themes most need remapping in aid of minimising need for debate about whether interpretation "on screen" is adequate or rather field inspection is required with regard to appraising the status of particular land parcels in relation to proposed development under planning scheme rules. References Allan, I. and Peterson, J.A., (1993), The application of spatial data processing to land use conflict resolution in the Lal Lal water catchment on the Ballarat growth corridor: a case study from Chapter one of the Buninyong Planning Scheme. Australian Geographer, 42 (2), 76-88. Allan, I., (1994), Salvaging the Unsalvagable: Archival Soil Maps Enter the Digital Age, Proceedings of the AIAS Conference, Ulverstone, Tasmania. Angold, P.G., Gurnell A.M., and Edwards P.J., (1996), Locational Errors in Maps from Environmental Surveys and Their Implications for Information Extraction, Journal of Environmental Management, 47, 341-354. Bailey, R., (1989), Beattie Appeal, AAT Appeal no.P.89/1824, 07/09/89, (Melbourne: Administrative Appeals Tribunal). Bate, W., (1978), Lucky City: The First Generation at Ballarat 1851-1901 (Melbourne: Melbourne University Press). Burrough, P.A., (1986), Principles of Geographical Information Systems for Land Resources Assessment (Oxford: Clarendon Press). Burrough, P.A., (1989), Modelling Land Qualities in Space and Time. In Land Qualities in Space and Time: Proceedings of a Symposium organised by the International Society of Soil Science (ISSS), Wageningen, the Netherlands, 22-26 August 1988,edited by J.Bouma and A.K.Bregt ( Pudoc Wageningen,), pp.45-59. Chorley RJ, (1969), "The Drainage Basin as the Fundamental Geomorphic Unit", in Chorley RJ (ed), Introduction to Physical Hydrology, Methusen and Co Ltd, London, pp.37-60. Duncan, J.S. (ed.), (1983), Atlas of Victoria, ( Melbourne: Government Printer). FAO, (1974), A framework for Land Evaluation (Rome:FAO). FAO, (1983), Guidelines: evaluation for rain fed agriculture (Rome: FAO ). Firns P.G., and Benwell G.L., (1991), ER on the Side of Spatial Accuracy. In Proceedings: Symposium on Spatial Database Accuracy, Department of Surveying and Land Information, Melbourne University, June, pp.192-202. Gahegan, M., (1994), Support for the Contextual Interpretation of Data within an Object-Oriented GIS, in Waugh, T.C. and Healey, R.G. (eds), Advances in GIS Research, Proceedings of the Sixth International Symposium on Spatial Data Handling, Vol.2., pp.988-1001, Taylor and Francis. Gahegan, M., (1995), Proximity Operators for Qualitative Spatial Reasoning. In Frank, A.U. and Kuhn, W, (eds), Spatial Information Theory, a Theoretical Basis for GIS, International Conference COSIT ‘95 Simmering, Austria, September 21-23, 1995, Proceedings, pp.31-44, Springer. Goudie, A (ed.), (1985), Encylopaedic Dictionary of Physical Geography (Oxford:Blackwell). Jamilla, S., and August, P., (1996), Capture Digital Imagery for your GIS, GIS World, 9(9), pp.50-51. Jeffery, P., (1980), A Study of Land Capability in the Shire of Buninyong (Kew, Victoria: Soil Conservation Authority). Maffini, G., Arno, M., and Bitterlich, W., (1989), Observations and Comments on the Generation and Treatment of Error in Digital GIS Data. In Goodchild, M. and Gopal, S., (eds), (1989, Accuracy of Spatial Databases, Taylor and Francis, London, pp.55-67. McDougall, E.B., (1975), The Accuracy of Map Overlays, Landscape Planning, 2, pp.23-30 Marsden, I.R., (1987), Rinaldi AAT Appeal no.P86/1924, 19/03/87, (Melbourne: Administrative Appeals Tribunal). Monmonier, M., (1991), How to Lie with Maps, University of Chicago Press, Chicago. Peterson, J.A. and Wigan, M. (1995) Constraints upon the diffusion of digital data handling for planning at local government level in Victoria, Australia, In Proceedings of the fourth International Conference on Computers in Urban Planning and Urban Management, (Melbourne:University of Melbourne), pp.495-503. Pereina, J.M.C., and Itami, R.M., (1991) GIS-Based Habitat Modelling Using Logistic Multiple Regression: A Study of the Mt.Graham Red Squirrel, Photogrammetric Engineering and Remote Sensing, 57(11), pp. 1475-1486. Powell, J.M., (1994), A legacy of competing imperatives: environment and development in Australia since 1788, Land Degradation and Rehabilitation, 5, pp.89-106. Qasco, (1993), aerial photography contractors, Melbourne Office, Australia. Rowan, J., (1983), Land Types, in Duncan JS (ed), 1983, Atlas of Victoria, (Melbourne: Government Printer), pp39-47. Survey and Mapping Victoria, (1982), 1:25,000 scale Mapsheet of Warrenheip 7622-1-.1 Thapa, K. and Bossler, J., (1992), Accuracy of Spatial Data Used in Geographical Information Systems, Photogrammetric Engineering and Remote Sensing, 58(6), pp.835-841. Tian, D. and Peterson, J., (1992), Mapping the Australian Duricrusts: Can Distribution be Derived from Terrain maps, Australian Geographical Studies, 30(1), pp.87-93. Veregin, H., (1989), Error Modelling for the map Overlay Operation. In Goodchild, M. and Gopal, S. (eds), (1989, Accuracy of Spatial Databases, Taylor and Francis, London., pp.3-18. Victorian Government, (1973), Victorian Government Gazette, No.110, 14th November, (Melbourne: Government Printer). Weigel, G., (1986), The Soils of the Maybar/Wello Area. Their Potential Constraints for Agricultural Development. A Case Study in the Ethiopian Highlands, Geographica Bernensia, Vol.A4, Berne, Switzerland. Wokabi, S.M., (1988), Kenyan Physical land Evaluation System. In Bouma J and Bregt AK (eds) Land Qualities in Space and Time. Proceeding of a Symposium Organised by the International Society of Soil Science (ISSS), Wageningen, the Netherlands, 22-26 August 1988, Pudoc Wageningen.
|
|
||||
|
Editorial | Editorial Board | Articles | Submit | Journal Home | OLP Home |