The Segregation Model | Variations on the Basic Segregation Model | Addition of Agents
- Source Code for Add and Remove Segregation model (656 KB)
- Shapefile (12 KB)
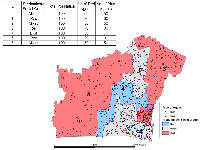
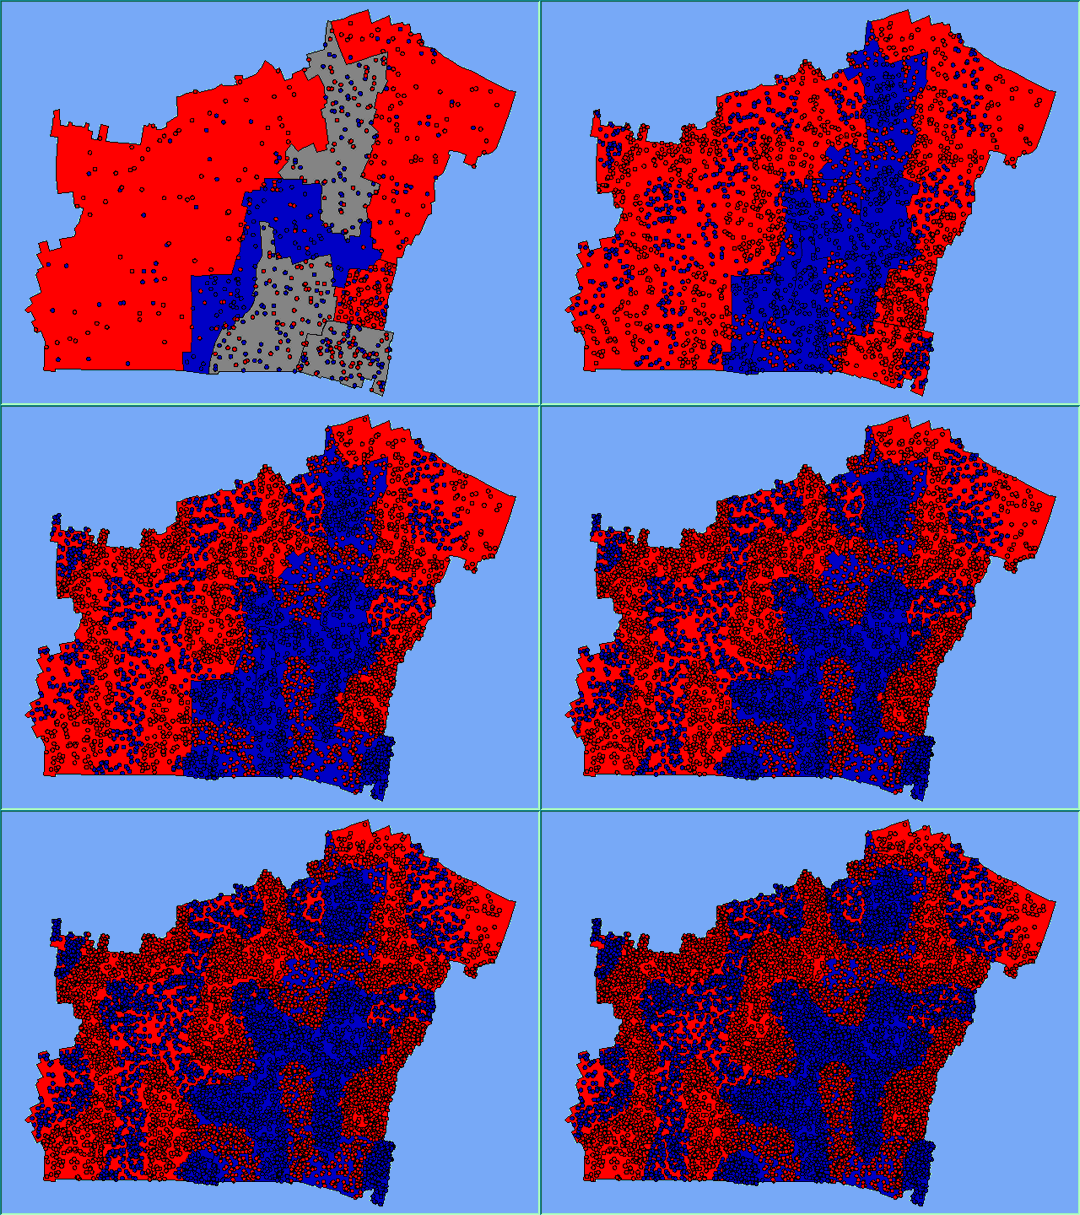
This test explore the situation when agents are only added and only removed from the system if they became dissatisfied. In each simulation the same area was used where the initial population was 700 agents (390 of type red (55.7%) and 310 of type blue (44.3%)). These agents were spread over several polygons as highlighted in Figure 1. Within the area, there were 3 areas where the predominant social group was red (i.e. 70% of the population was red), 1 area where the predominant social group was blue (70%) and 3 areas were classified as mixed (population composed of 50% of both groups). 100 new agents are added to the system at the end of each step. Each agent wanted to be in an area where 50% or more of its neighbours are of the same type. Neighbourhoods were defined as 100m radius. To see the impact when agents are both added and removed click here (Addition and Removal of Agents).
Figure 1: Initial starting conditions for the simulations with agents distributed randomly within their areas.
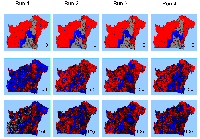
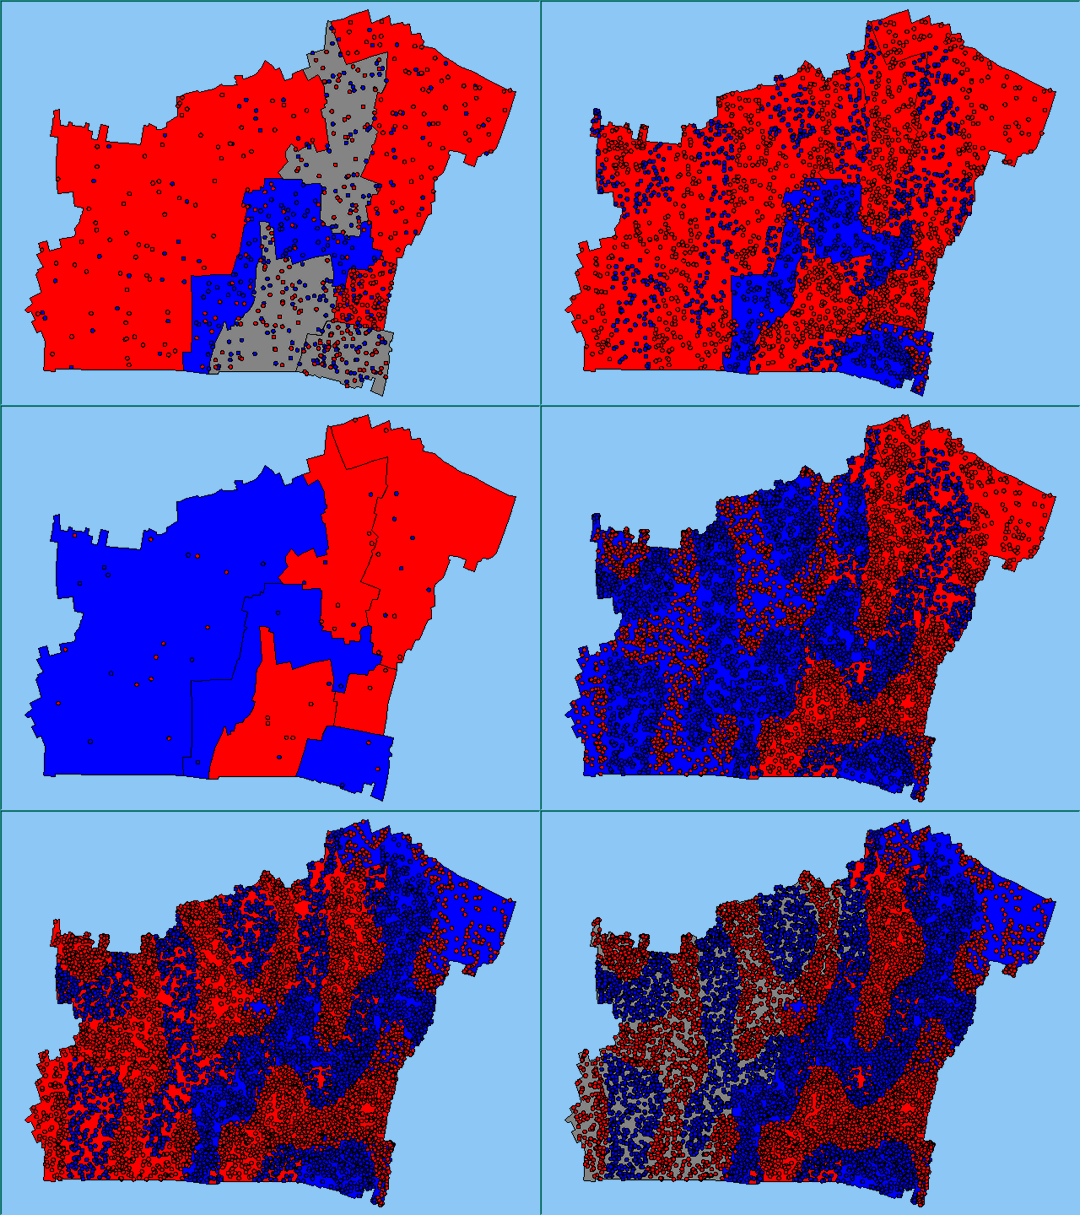
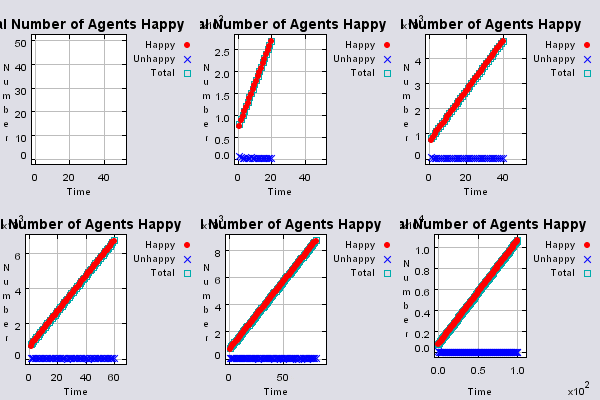
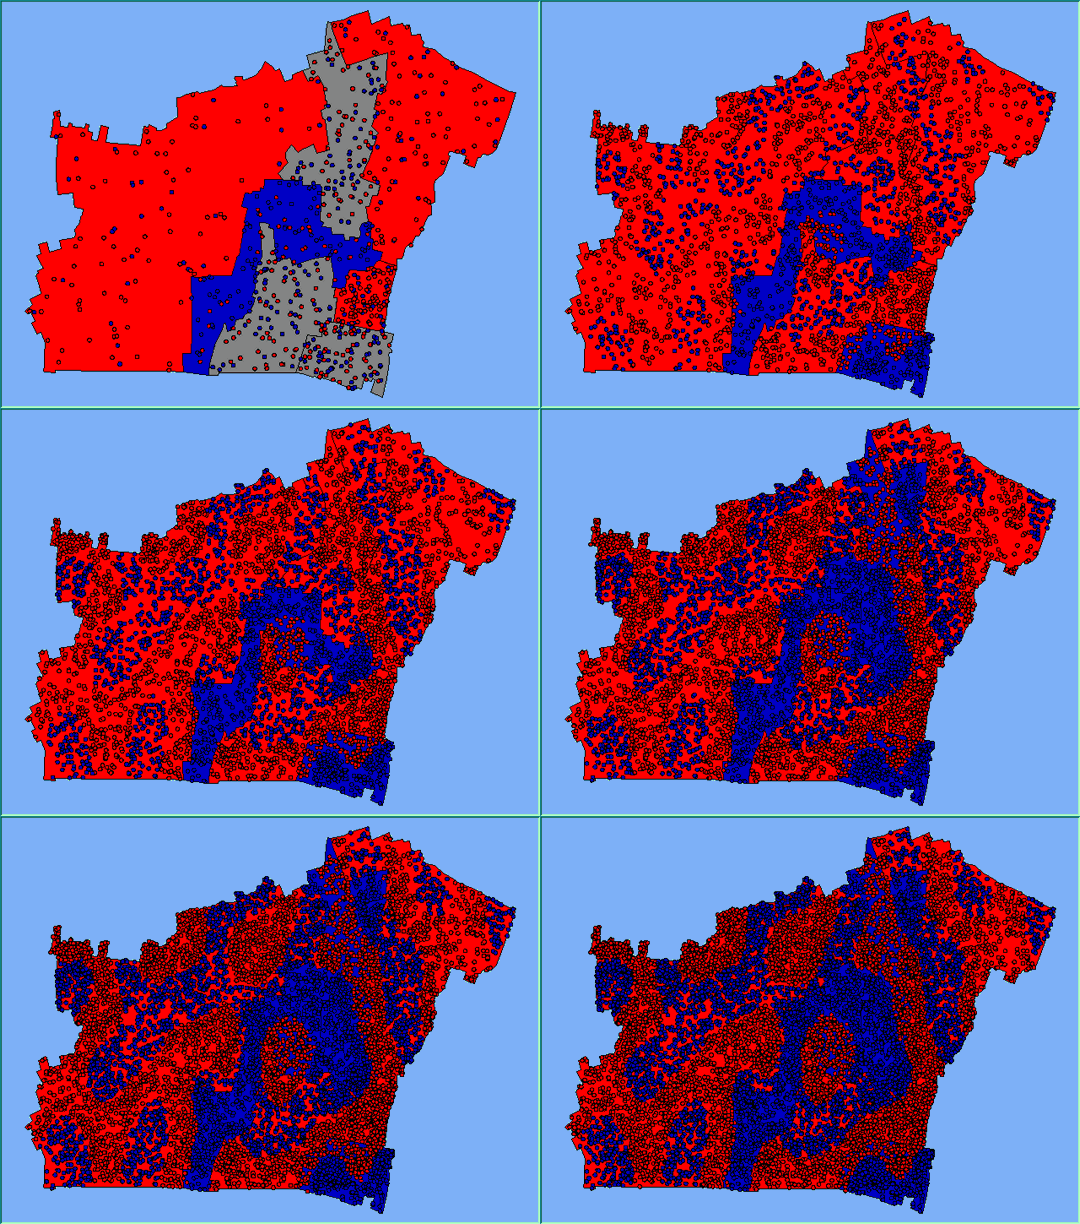
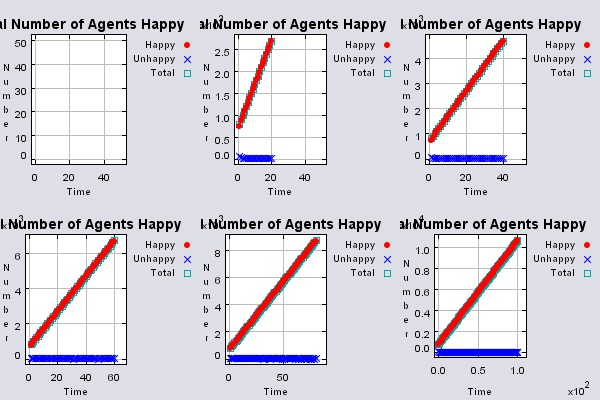
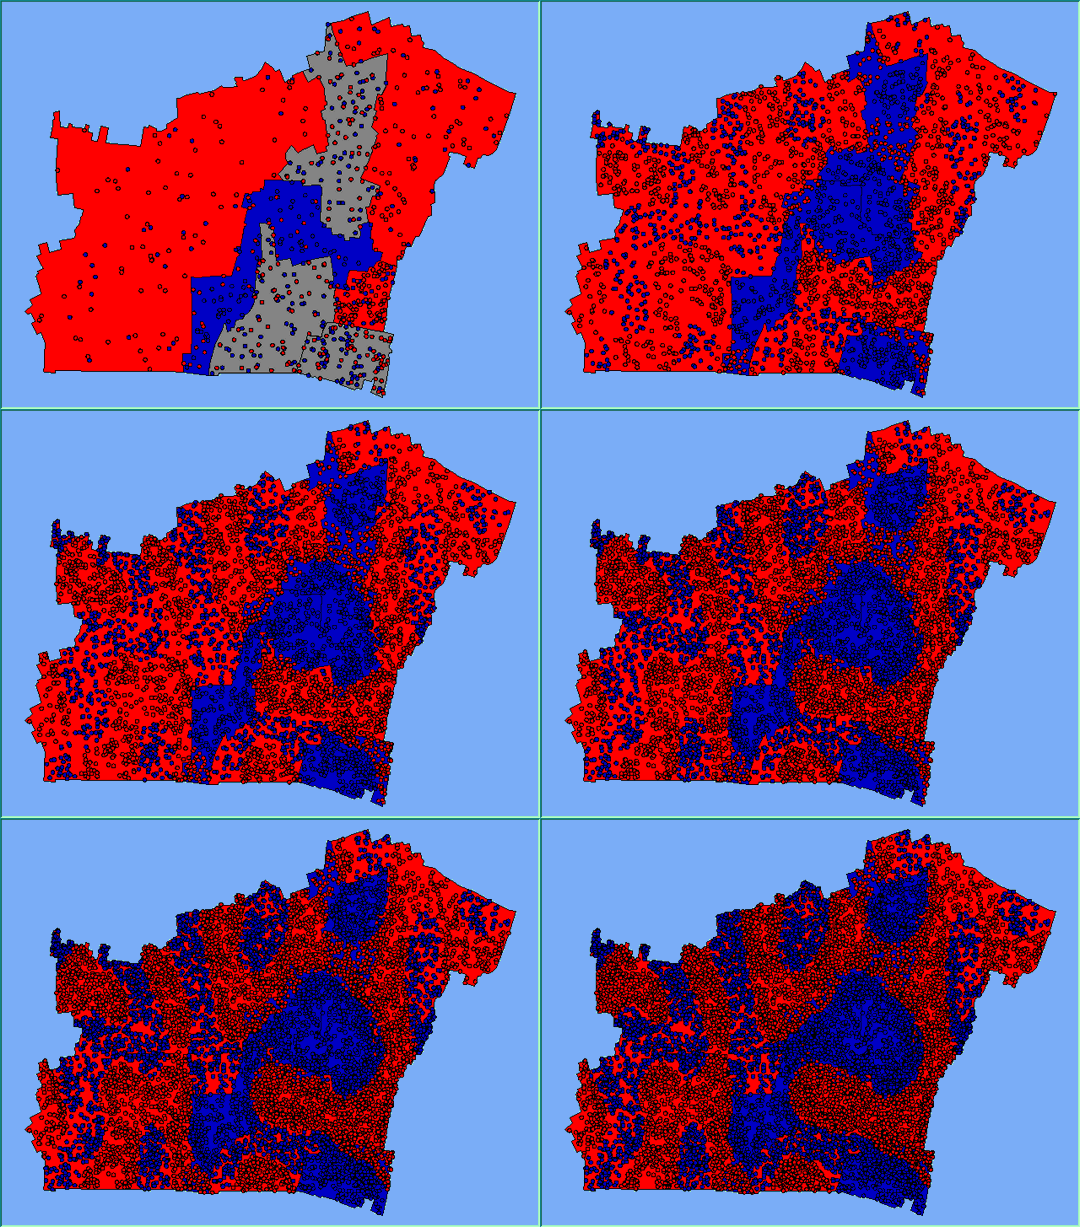
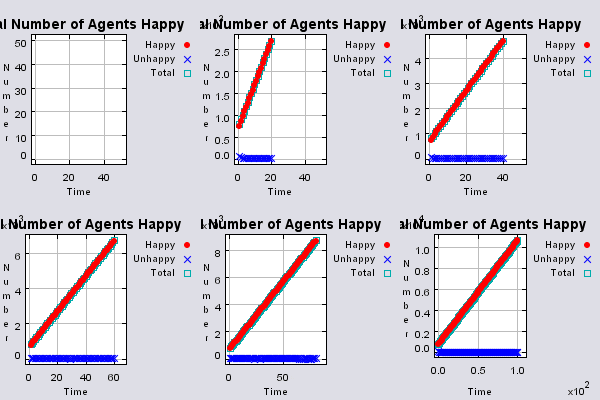
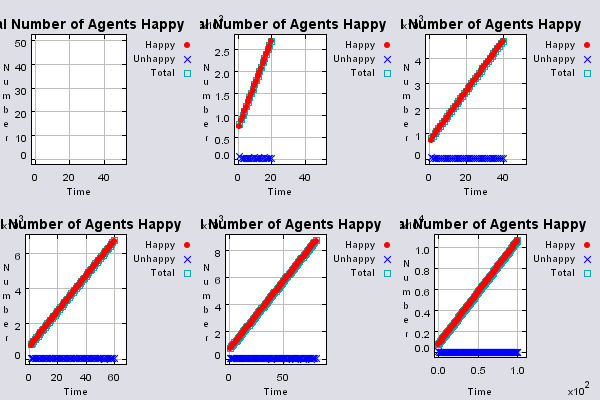
No agents were removed because they could not find a neighbourhood where they were satisfied. Table 1 shows the aggregate results of a selection of model runs where agents were only added. During the course of the simulation, the percentage of each colour making up of the total population is roughly equal. However, the number of areas where one group is predominant varies. Table 1 additionally highlights that with the addition of new agents, exiting agents which would have been satisfied with their neighbourhoods become dissatisfied. Figure 2 shows the screen captures of the initial configuration, at time step 50 and at time step 100. It is clear that clusters that appear at time step 50 are reinforced as the simulation advances and the clusters become more concentrated at the same time expanding and reinforcing the pattern of segregation. Additionally Figure 2 highlights how clusters of groups do not stop at boundaries of areas. So while the aggregate data suggests that the area is predominantly of one type, clusters of distinct groups appear throughout the area and cross the boundaries between areas. These clusters would have been lost by purely using aggregate information. Even in the case where one area contains equal numbers of red and blue agents, distinct patterns of segregation are noticeable. Animations of these simulation runs where agents where added and not removed can be seen below..
Table 1: Results from simulations where agents where only added.
Figure 2: The effect of adding agents and the resulting pattern of segregation.
Animations of simulation runs where agents were only added up to 100 iterations
 |
 |
 |
 |
 |
 |
 |
 |

